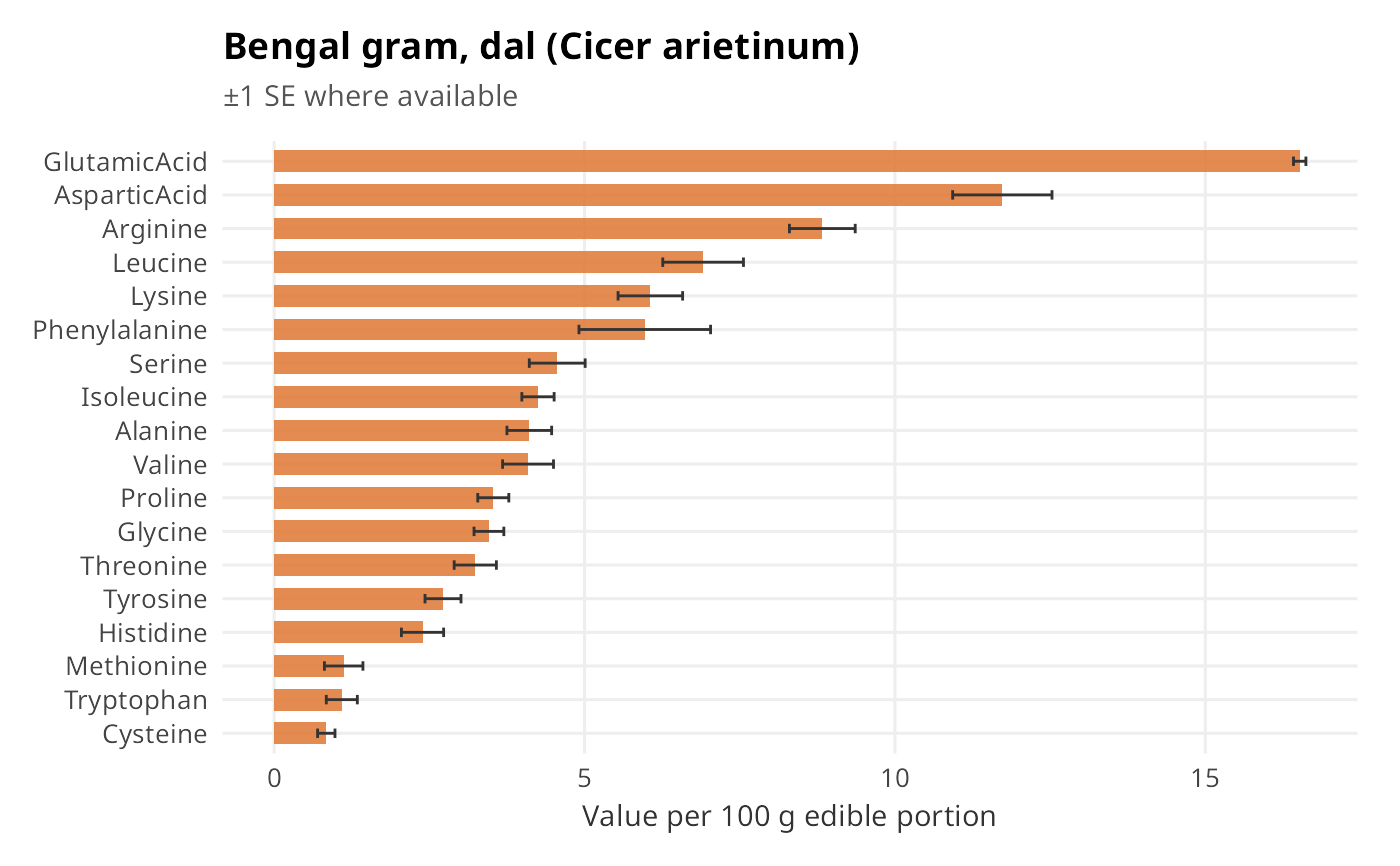
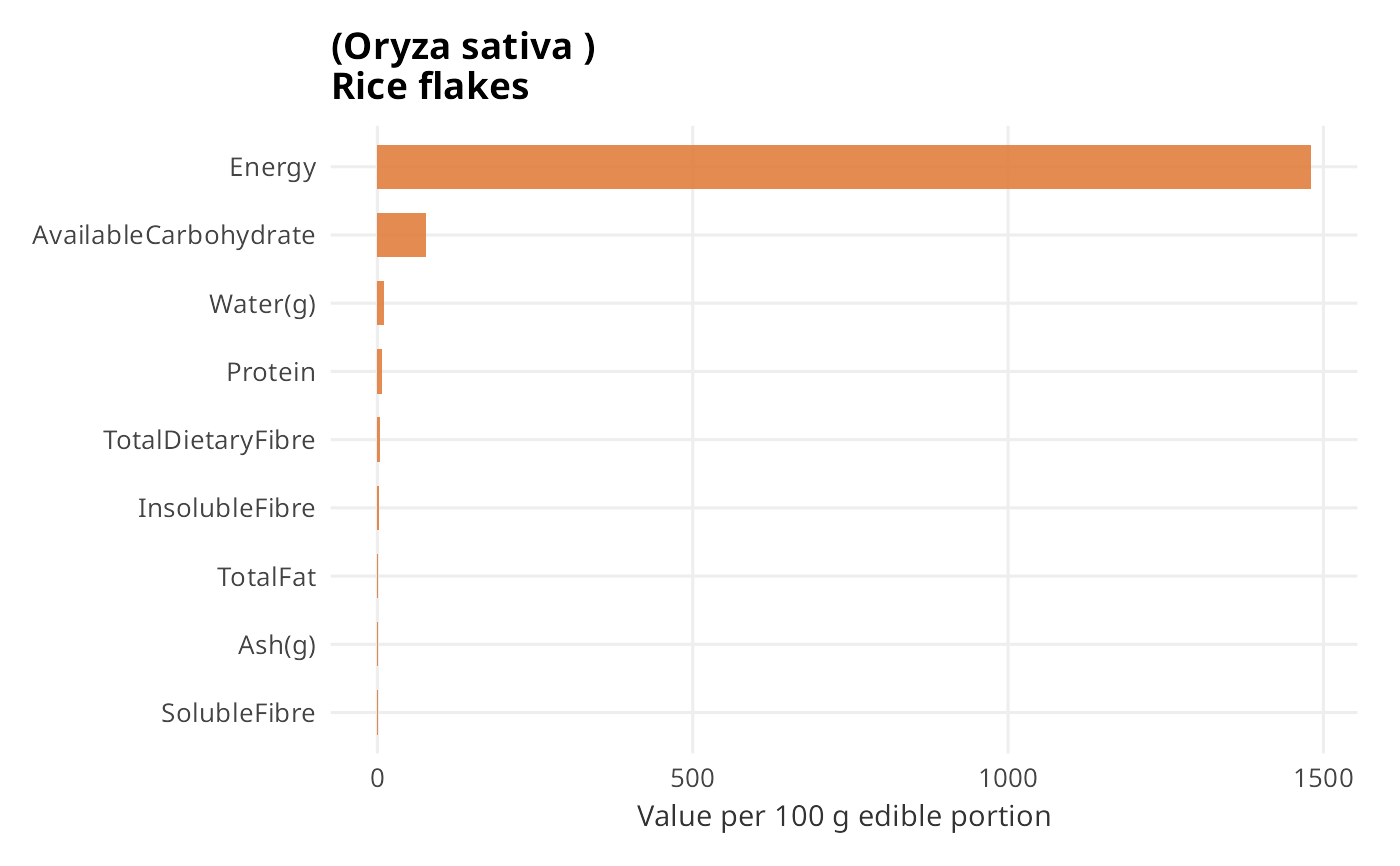
Horizontal bar chart of nutrient values for a single food with optional SE error bars. Only nutrients with a non-NA point estimate are shown.
Arguments
- food
Food name (substring) or exact food code.
- table
IFCT table name (e.g.
"amino_acids").- nutrients
Optional character vector of column-name substrings to include.
NULLkeeps all columns.- se
If
TRUE(default), add SE error bars where available.- label_fn
Function applied to column names to produce axis labels.
- title
Plot title. Defaults to the matched food name.
- subtitle
Plot subtitle.
- xlab
x-axis label.
- match
One of
"fixed"(default) or"regex".