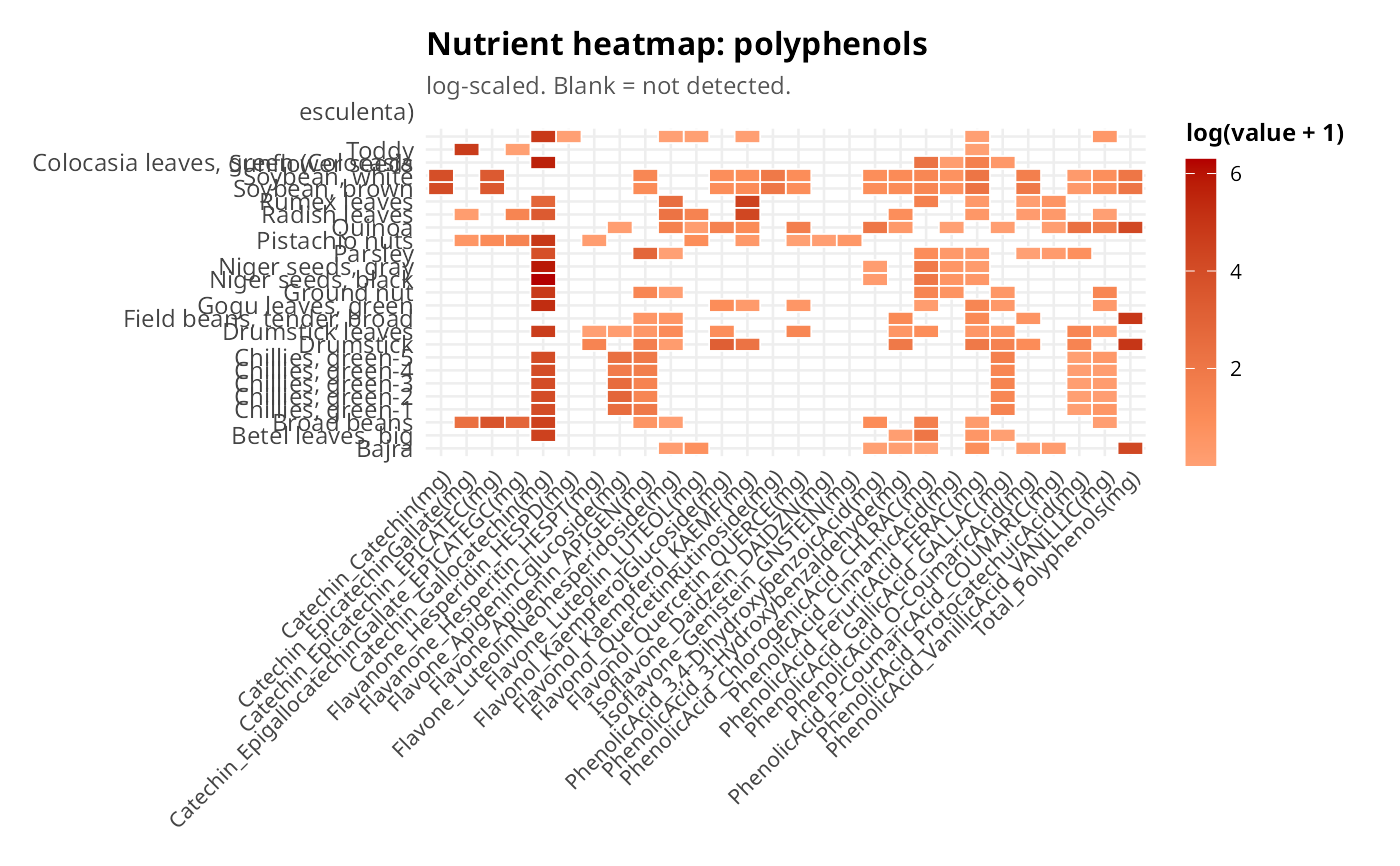
Tile heatmap of foods (rows) by nutrients (columns). Selects the top n
foods by row sum and applies log1p colour scaling by default.
Usage
plot_heatmap(
  table,
  drop_cols = NULL,
  n = 25L,
  log_scale = TRUE,
  label_fn = .short_label,
  var_label_fn = function(x) x,
  title = NULL
)
Arguments
- table
IFCT table name.
- drop_cols
Columns to exclude.
- n
Number of foods to show (default 25).
- log_scale
Apply log1p before colour mapping (default TRUE).
- label_fn
Function to shorten food names (rows).
- var_label_fn
Function to shorten nutrient names (columns).
- title
Plot title.
Examples
plot_heatmap("polyphenols", n = 25)