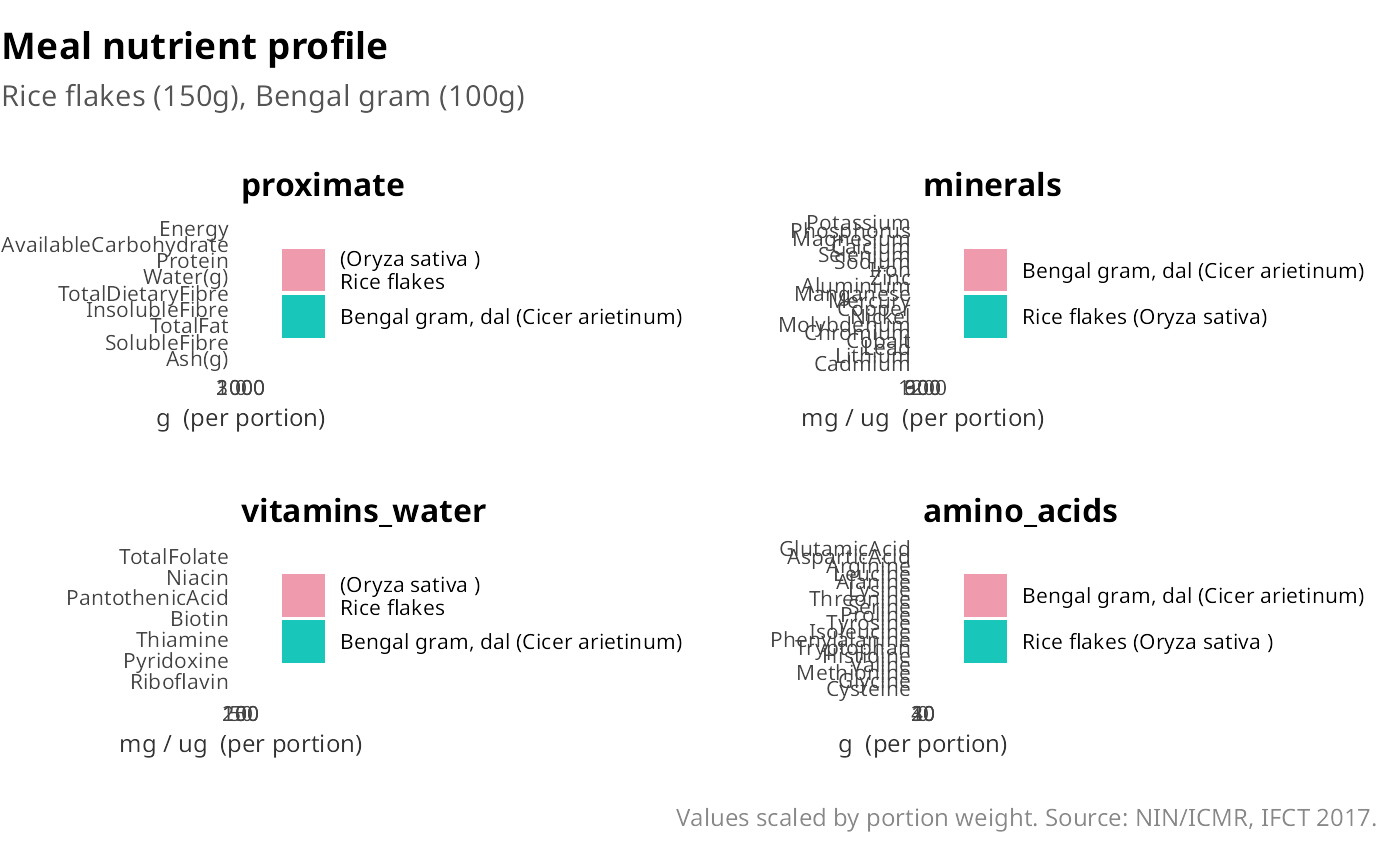
Stacked bar chart of meal nutrient contributions by ingredient
Source:R/plots.R
plot_meal_profile.RdFor each IFCT table in the meal, draws a horizontal stacked bar where each segment is one ingredient's contribution. Tables with all-zero nutrients are skipped.
Arguments
- meal
Named list returned by
compose_meal().- tables
Character vector of table names to plot. Defaults to
c("proximate", "minerals", "vitamins_water", "amino_acids").- label_fn
Function to shorten nutrient column names.
- ncol
Number of panel columns (passed to
patchwork::wrap_plots()).- title
Overall plot title.
Examples
meal <- compose_meal(c("Rice" = 150, "Dal" = 100))
#> ✔ Meal composed: 2 ingredients across 12 tables.
plot_meal_profile(meal)