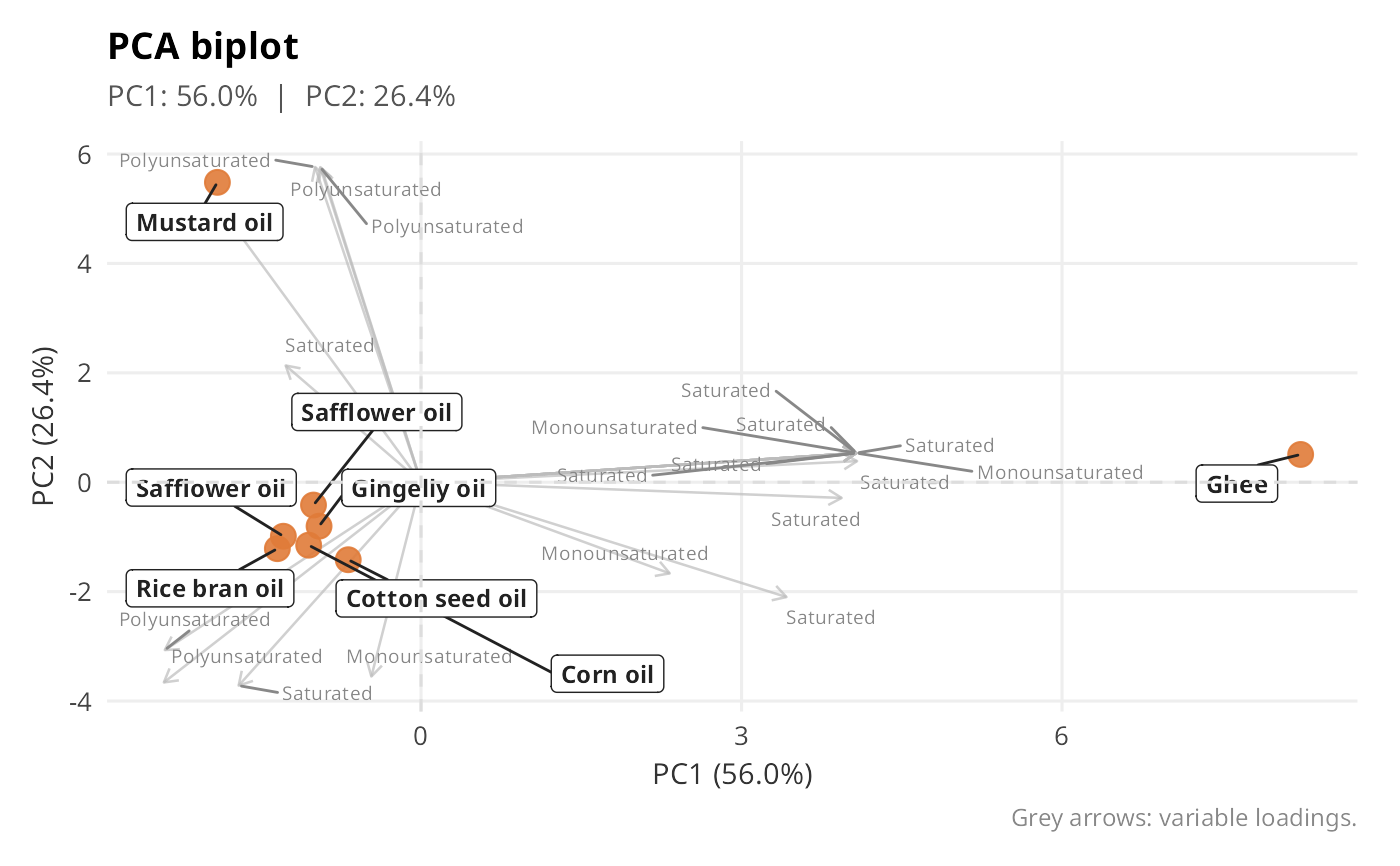
Score points (labelled) overlaid with scaled loading arrows. Best for small datasets where every point can be labelled (e.g. edible oils).
Usage
plot_pca_biplot(
  pca_result,
  pc_x = 1L,
  pc_y = 2L,
  score_label_fn = .short_label,
  load_label_fn = function(x) gsub("_.*", "", x),
  point_colour = "#E07B39",
  title = NULL
)
Arguments
- pca_result
List from
run_pca().- pc_x, pc_y
PC axes (default 1 and 2).
- score_label_fn
Function to shorten food names.
- load_label_fn
Function to shorten variable names.
- point_colour
Score point colour (default
"#E07B39").- title
Plot title.