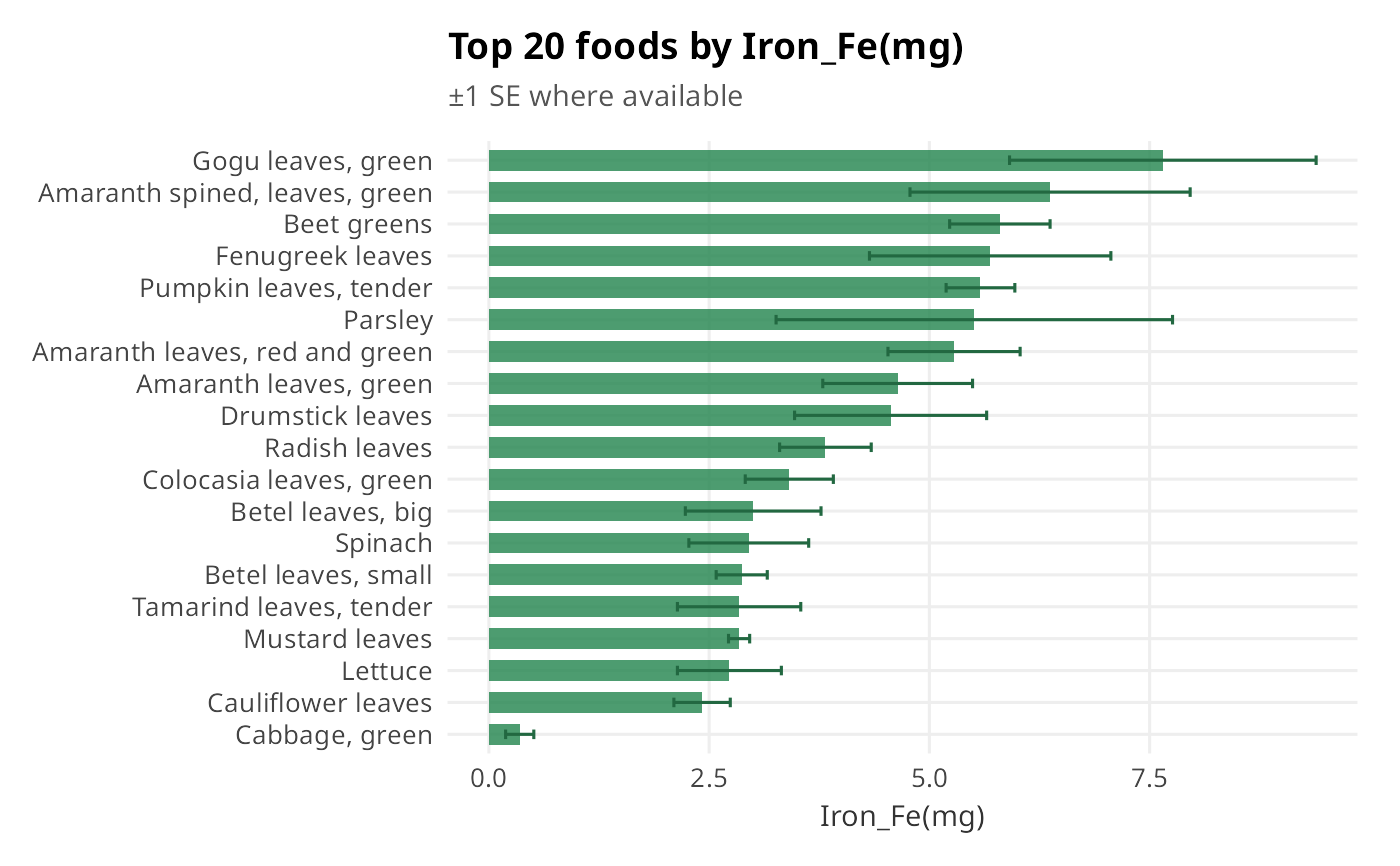
Top (or bottom) n foods by a nutrient, optionally filtered to a food
group. Supplying se_table restricts output to foods with a non-NA SE and
adds error bars.
Usage
plot_ranked(
  table,
  nutrient,
  se_table = NULL,
  food_group = NULL,
  n = 20L,
  ascending = FALSE,
  fill = "#E07B39",
  title = NULL,
  subtitle = NULL,
  xlab = NULL
)
Arguments
- table
IFCT table name.
- nutrient
Exact column name.
- se_table
Optional SE data frame (the
_secounterpart oftable).- food_group
Optional food group name to filter to.
- n
Number of foods to show (default 20).
- ascending
If
FALSE(default), highest values first.- fill
Bar colour (default
"#E07B39").- title
Plot title.
- subtitle
Plot subtitle.
- xlab
x-axis label.
Examples
plot_ranked("minerals", "Iron_Fe(mg)",
  se_table   = thali_minerals_se,
  food_group = "Green Leafy Vegetables",
  fill       = "#2E8B57"
)
#> Warning: Use of `df[[nutrient]]` is discouraged.
#> ℹ Use `.data[[nutrient]]` instead.
#> Warning: Use of `df[[nutrient]]` is discouraged.
#> ℹ Use `.data[[nutrient]]` instead.