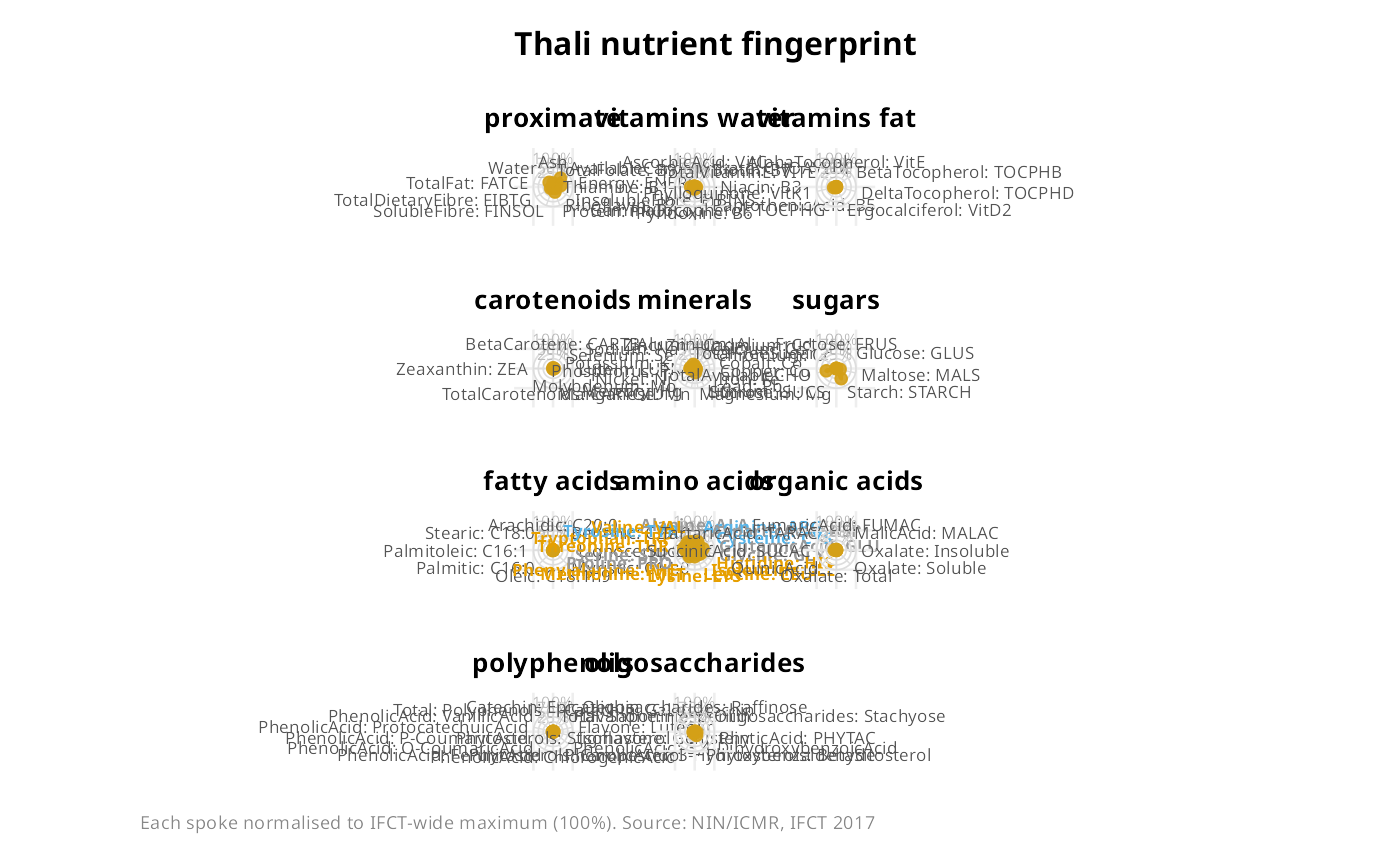
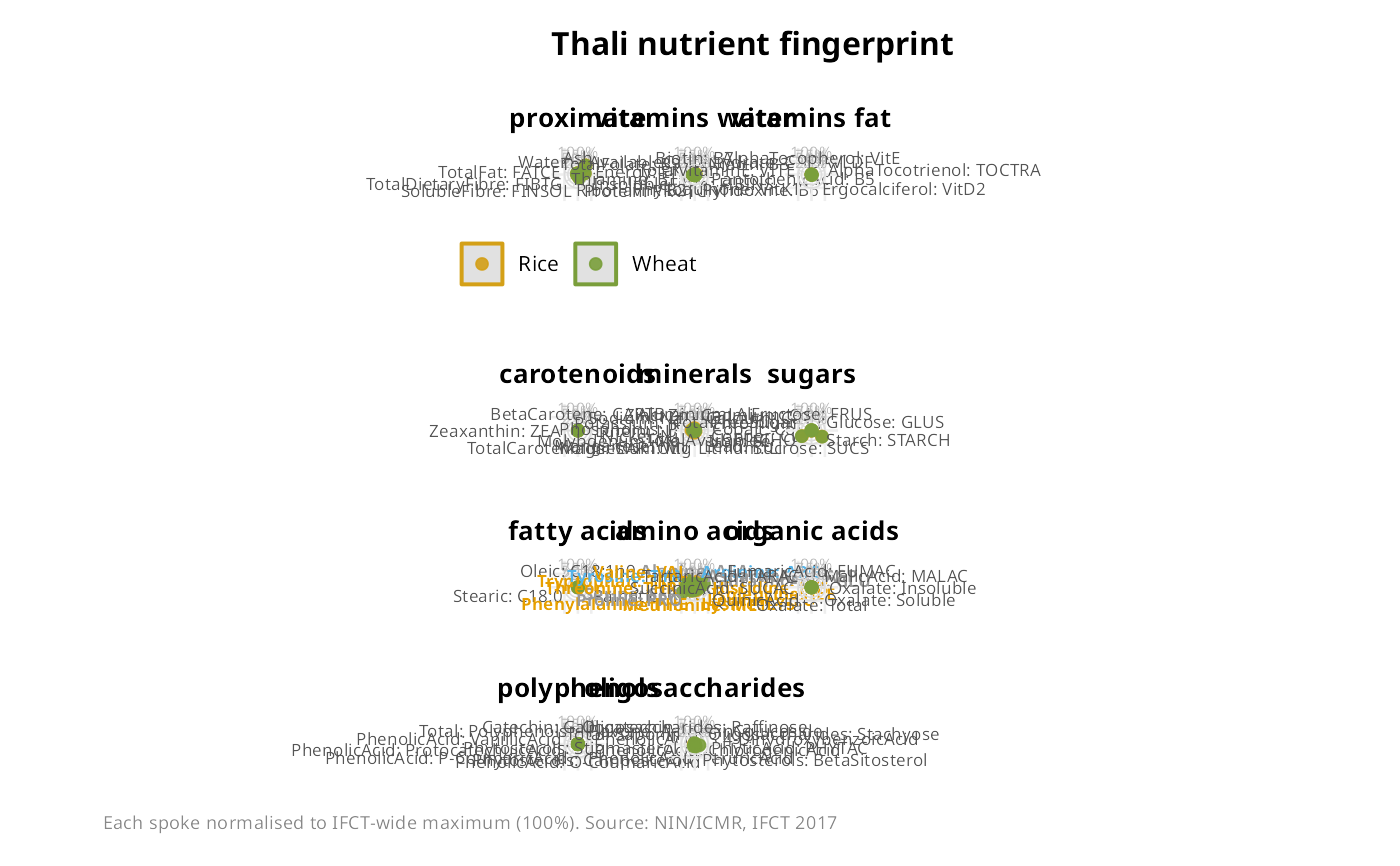
Draws one radar (spider) panel per nutrient category (proximate, amino acids, minerals, etc.), assembled into a grid with patchwork::patchwork. Each spoke is normalised to [0, 1] using the IFCT-wide maximum for that nutrient, so shapes show how the meal compares to the full diversity of Indian foods.
Usage
thali_plot(
  meals,
  tables = setdiff(.table_names, "edible_oils"),
  title = "Thali nutrient fingerprint",
  base_size = 10,
  ncol = 3L
)
Arguments
- meals
A single meal: either a named list from
compose_meal()or a named numeric vector forwarded tocompose_meal(). For comparison, pass a named list of such objects, e.g.list(Rice = c("Rice" = 150), Dal = c("Bengal gram" = 100)).- tables
Character vector of IFCT table names to include. Defaults to all tables except
"edible_oils".- title
Overall plot title.
- base_size
Base font size (default 10).
- ncol
Number of columns in the panel grid (default 3).